Behzadgof
-
Posts
1 -
Joined
-
Last visited
Behzadgof's Achievements
")
Newbie (1/14)
0
Reputation
-
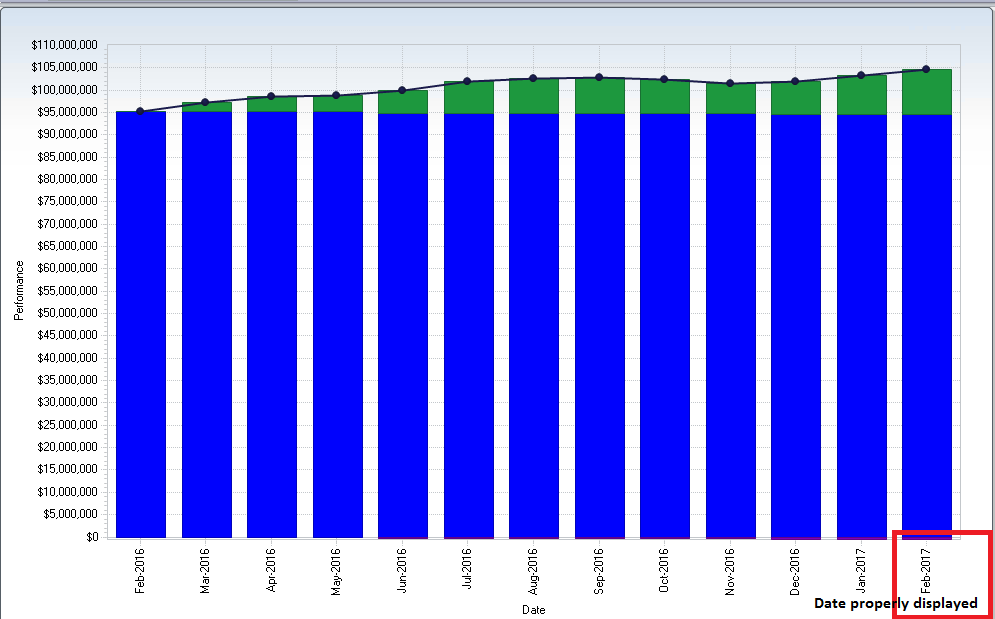
When chart is maximized the date on x Axis shifts to the left. Below is the chart property settings. With Me.RollingPerformanceChart .Data.Clear() .Series.Clear() .ToolTipFormat = "%L" '.Titles(0).Text = "Performance" .Data.Labels.Clear() .AxisX.LabelsFormat.CustomFormat = "MMM-yyy" .AxisX.LabelsFormat.Format = AxisFormat.Date .AllSeries.PointLabels.LineAlignment = System.Drawing.StringAlignment.Center Dim SeriesAttributes1 As ChartFX.WinForms.SeriesAttributes = New ChartFX.WinForms.SeriesAttributes() 'CC# 24 SeriesAttributes1.PointLabels.Alignment = System.Drawing.StringAlignment.Center .Series.AddRange(New ChartFX.WinForms.SeriesAttributes() {SeriesAttributes1}) .AxisX.LabelAngle = 90 .AllSeries.PointLabels.Format = "%L" .AxisY.DataFormat.Decimals = 0 .AxisY.LabelsFormat.Format = AxisFormat.Currency .AxisY.Min = minValue * 1.5 .AxisY.Max = maxValue * 1.2 .AllSeries.Visible = True .AxisY.AutoScale = True .AxisY.ResetScale() .RecalculateScale() .AxisX.AutoScale = True .AxisX.ResetScale() End With